Showing posts with label big data. Show all posts

Saturday, November 10, 2012

Making sense out of election data

The other day I wrote about NYTimes visual reports on Presidential election result.  I wanted to share a couple of examples of how each perspective can create different reports.

Raw data is like an uncut diamond.  Once you process the data to answer a question, only then you get a story that makes sense.  Data is only as good as what you pick out from them.

1. Nate Silver's Preliminary 2012 Election results by state

Among election analysts, there has been a clear winner: Nate Silver.  He correctly projected 50 state's presidential electoral votes.  Here's one of the famous reports that Nate Silver created.  It ranks all states by GOP and Democratic Party's winning margins.  The report shows how Democrats would have still won the election even if they lost Virginia, Ohio, and Florida.
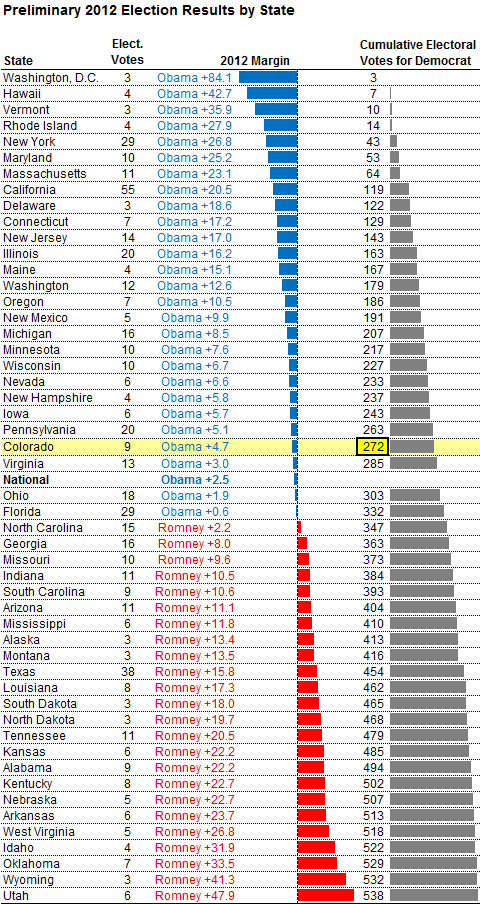
Source: http://flapsblog.com/wp-content/uploads/Nate-Silver-Presidential-tipping-point.png

2. NPR Campaign Money Map

NPR highlights a different question from the raw data.  They are looking at purple states, so-called swing states, where GOP and Democratic Party support are neck and neck.  These are states where majority of campaign moneys are spent.  If you look at Nate Silver's election results, these are states that are squarely in the middle.  When it comes to presidential election, it is all about these 12 state contests.


Imagine doing this kind of analysis on your raw data.  We are already collecting lots of data through our mobile phone, web browsers, and cloud service providers.  I can see the day when we will be able to visualize our own behavioral patterns.

Tuesday, November 6, 2012

Visualizing Presidential election

Even before polling places closing reporters and pundits have been projecting the winner through out the night.  It is 11:10 PM Pacific time, and we already know how the American people voted.

Although there is one winner in any election, there are many ways to look at how people voted.  By state, by religious belief, married or single, education background and by income level, to name a few.  This incredibly rich way of dissecting data is what makes Big Data analysts excited.  As analysts gain more insights about the data set and as they explore the relationships among different factors, there continues to be new reports that the analysts can create.

NYTimes has done another excellent work in presenting the Presidential election result.

Source: http://elections.nytimes.com/2012/results/president

A good report tells a story.  A good visual report tells a story without using words and numbers.

Sunday, April 22, 2012

We are all feeding big data

A week or so ago, I wrote about Placeme app by Alohar Mobile, mobile application that automatically records your location.  If you feel that a device tracking your whereabout at all time is creepy, you are not alone.  It's natural to feel that way.  But whether we like it or not, we are all getting swept up in big data wave.  That's because everything about what we do is getting recorded.

Think about anything that you do online.  Whenever you are visiting a website, you are causing the web server to respond to you with a web page.  Each time that happens website can record the fact that it served the page to you (if you are registered user, if not just IP address).  Imagine getting all these data available for quick search by the visitor.  It will tell the website that what users are doing.  More importantly it will allow the website to model how you have been acting, and predict what you might do next.

It's not just online data.  Technology for recording our driving habit is already around us.  Since 1996, Event Data Recorder has been a part of most automobiles sold in U.S.  It records acceleration, brake, rpm, etc. each time you get behind the wheel.  Chances are that you are driving a car that has EDR recording every driving decision that you make.

And installing EDR is about to become a law.  Moving Ahead for Progress in the 21st Century Act (MAP-21) will mandate all auto manufacturers to install EDR and record all driving history.  The data will be accessible to car owners and will be requested by court if needed in legal proceeding.

All these data recording is what's fueling big data.  And we are seeing the first wave of this big data.  With Splunk IPO, expect more big data companies and data analysis firms to make headlines.

Sunday, March 18, 2012

Big Data example: predictive policing

I want to share an example of Big Data.  It's called predictive policing.  Idea is a simple one.  Instead of asking how to solve existing crimes, the system is created to answer a different question.  Crimes are going to happen.  Given that crimes are happening, what is the pattern in crime statistics?  How can we predict where and what kinds of crimes are to happen?

We may not be relying on "precogs",
but predictive policing may come close;
thanks to Big Data
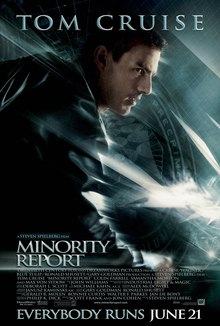
It's not quite predictive as "precogs" in Minority Report.  But the idea is powerful one.  If all crime statistics are collected and plotted, there are patterns.  Shifting crime-prone area can be foreseen by someone looking at all data points.  Police department can then use the data to allocate resources at right places to handle anticipated crimes.

The next step can be seeing how policy presence affects the crime pattern.  Effectively this predictive policing system will allow policy department to track how well they are doing and how criminals react to policy officer's response.  Imagine iterating on this idea on matter of days.  That could have profound implication to improving the crime statistics.

One key thing that must happen to realize the benefit of Big Data is collecting data.  It must be easy for police officers to share data among multiple departments.  Once this sharing of data is in place, the next thing is navigating through data.  System must allow user to answer his/her questions.  System should also suggest questions for user to ask.

Although this example is about predictive policing, it can be applied anywhere Big Data modeling can be useful.  It could be used in employee turnover, grocery shopping habit and traffic accidents just to name a few.  This Big Data will be a tremendous area of growth as more and more data become available online and easier to aggregate.