The other day I wrote about NYTimes visual reports on Presidential election result. I wanted to share a couple of examples of how each perspective can create different reports.
Raw data is like an uncut diamond. Once you process the data to answer a question, only then you get a story that makes sense. Data is only as good as what you pick out from them.
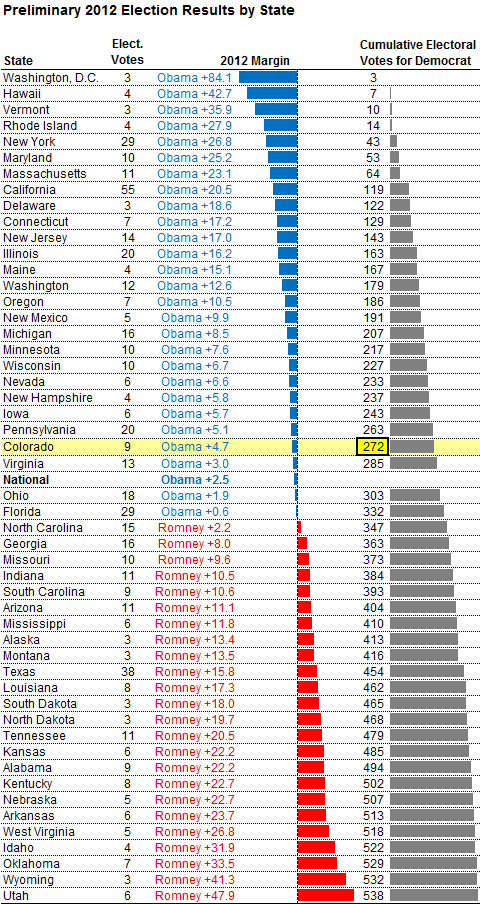
1. Nate Silver's Preliminary 2012 Election results by state
Among election analysts, there has been a clear winner: Nate Silver. He correctly projected 50 state's presidential electoral votes. Here's one of the famous reports that Nate Silver created. It ranks all states by GOP and Democratic Party's winning margins. The report shows how Democrats would have still won the election even if they lost Virginia, Ohio, and Florida.
2. NPR Campaign Money Map
NPR highlights a different question from the raw data. They are looking at purple states, so-called swing states, where GOP and Democratic Party support are neck and neck. These are states where majority of campaign moneys are spent. If you look at Nate Silver's election results, these are states that are squarely in the middle. When it comes to presidential election, it is all about these 12 state contests.
Imagine doing this kind of analysis on your raw data. We are already collecting lots of data through our mobile phone, web browsers, and cloud service providers. I can see the day when we will be able to visualize our own behavioral patterns.
Raw data is like an uncut diamond. Once you process the data to answer a question, only then you get a story that makes sense. Data is only as good as what you pick out from them.
1. Nate Silver's Preliminary 2012 Election results by state
Among election analysts, there has been a clear winner: Nate Silver. He correctly projected 50 state's presidential electoral votes. Here's one of the famous reports that Nate Silver created. It ranks all states by GOP and Democratic Party's winning margins. The report shows how Democrats would have still won the election even if they lost Virginia, Ohio, and Florida.
 |
| Source: http://flapsblog.com/wp-content/uploads/Nate-Silver-Presidential-tipping-point.png |
2. NPR Campaign Money Map
NPR highlights a different question from the raw data. They are looking at purple states, so-called swing states, where GOP and Democratic Party support are neck and neck. These are states where majority of campaign moneys are spent. If you look at Nate Silver's election results, these are states that are squarely in the middle. When it comes to presidential election, it is all about these 12 state contests.
Imagine doing this kind of analysis on your raw data. We are already collecting lots of data through our mobile phone, web browsers, and cloud service providers. I can see the day when we will be able to visualize our own behavioral patterns.
No comments:
Post a Comment